



Day Trade Setup — Andromeda

Trade with structure.
Execute with clarity.

A Multi-Mode trading indicator for TradingView designed to help traders identify potential trading opportunities, plan risk, and manage setups systematically — all directly on a single chart.

Combines Demand & Supply Zones, Market Structure, SuperTrend direction, automatic Entry, Stop Loss, and Take Profit levels, position-size calculation, setup history, and a monthly performance dashboard within one integrated system.

Built for TradingView Primarily designed for XAUUSD Supports Day Trade & Scalping Modes

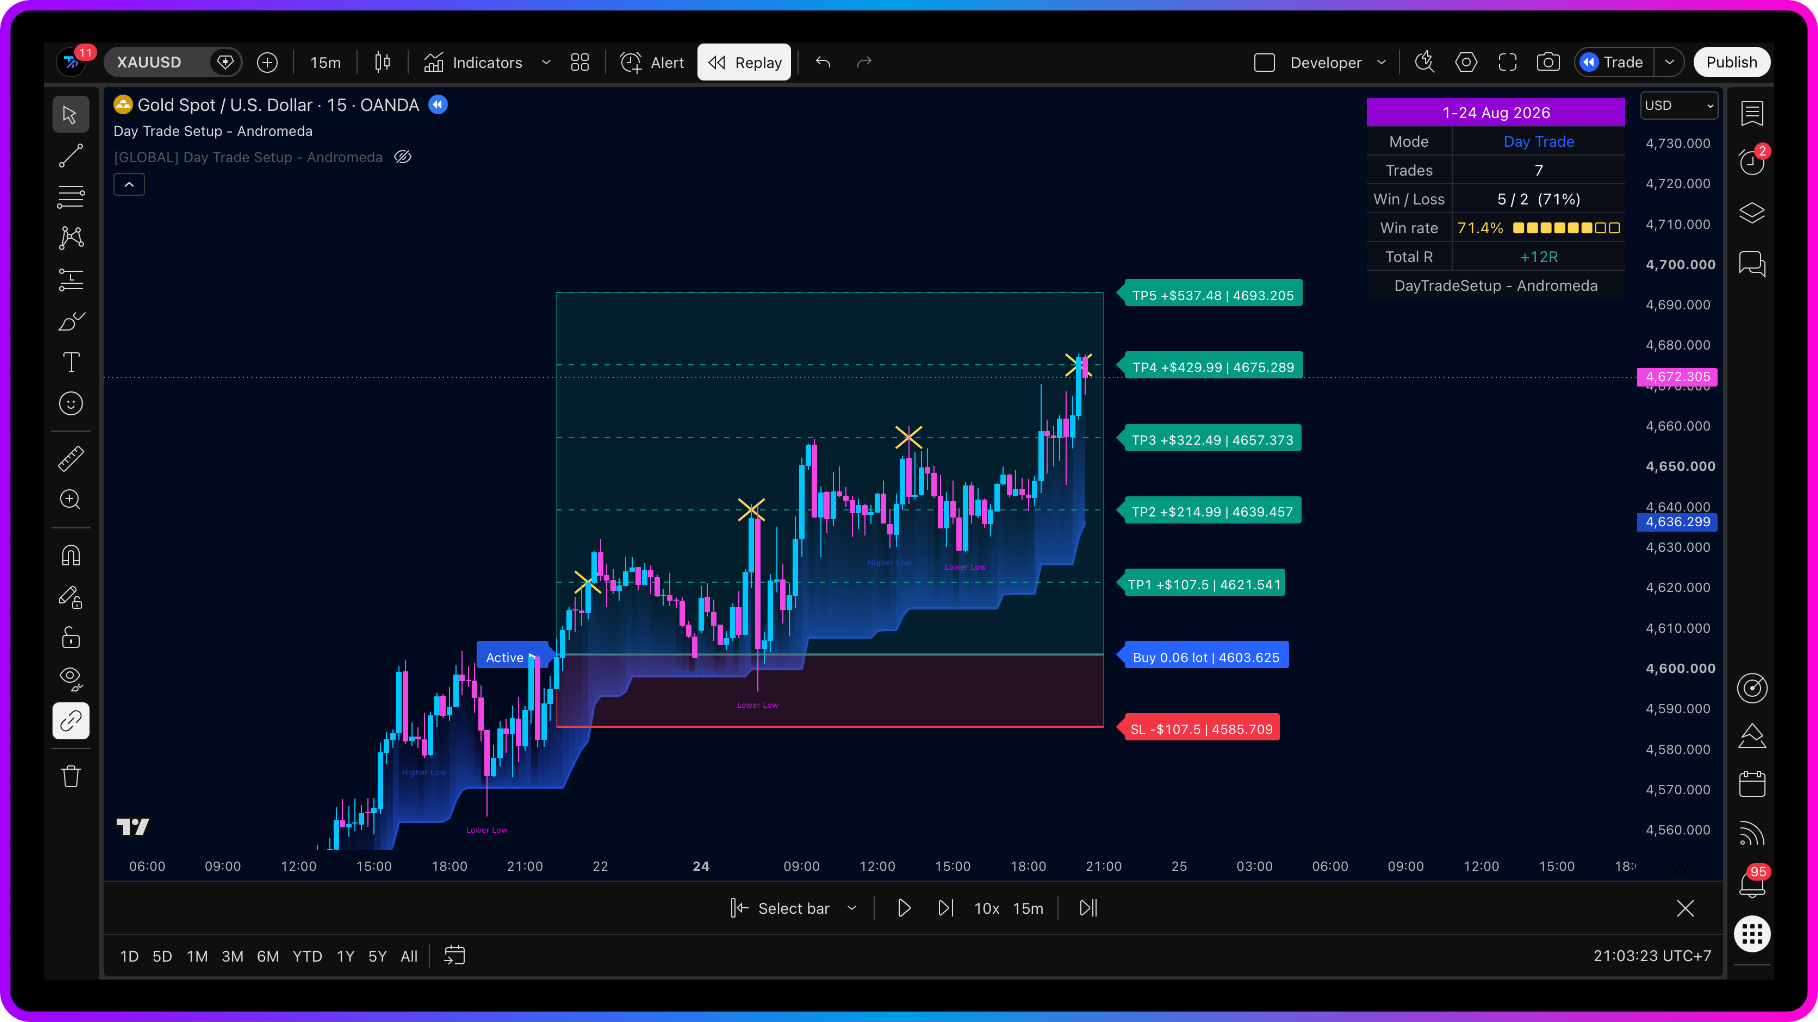
Day Trade Setup — Andromeda running on a TradingView XAUUSD chart, showing entry, stop loss, and take-profit levels
2 MODES
Day Trade + Scalping
AUTO
Entry / SL / TP
SMC
Market Structure
REAL-TIME
Trading Alerts

Everything You Need in One Trading System

Everything You Need
in One Trading System

Simplify your chart analysis with essential trading tools combined within a single indicator.

Day Trade Mode based on Demand & Supply Zones
Scalping Mode based on confirmed SuperTrend signals
Automatic Buy and Sell setup detection
Automatic Entry, Stop Loss, and Take Profit levels
Multiple Take Profit targets
Suggested lot size based on your selected risk level
Market Structure analysis
BoS and CHoCH detection
Active setup tracking
Completed setup history
Monthly performance dashboard
Win Rate and setup statistics
Real-time trading signal alerts

Two Ways to Trade the Market

Two Trading Modes
in One Indicator

Choose the mode that best matches your trading style and preferred trade duration.

Day Trade Mode

Demand & Supply-Based Setups

Day Trade Mode identifies potential Buy and Sell opportunities around active Demand Zones and Supply Zones.

When the system detects a setup that meets its conditions, the indicator initially displays a Wait status, allowing the user to wait for confirmation before considering an entry.

Once the price reaches the Entry level and the confirmation candle closes, the setup changes to Active. The indicator will then display the essential information required for trade planning, including:

  • Entry
  • Stop Loss
  • Multiple Take Profit levels
  • Suggested lot size
  • Estimated profit or loss
  • Current setup status on the chart

Day Trade Mode helps users plan trades around Demand and Supply Zones systematically while reducing the risk of entering before a setup has been confirmed.
Scalping Mode

Confirmed SuperTrend Signals

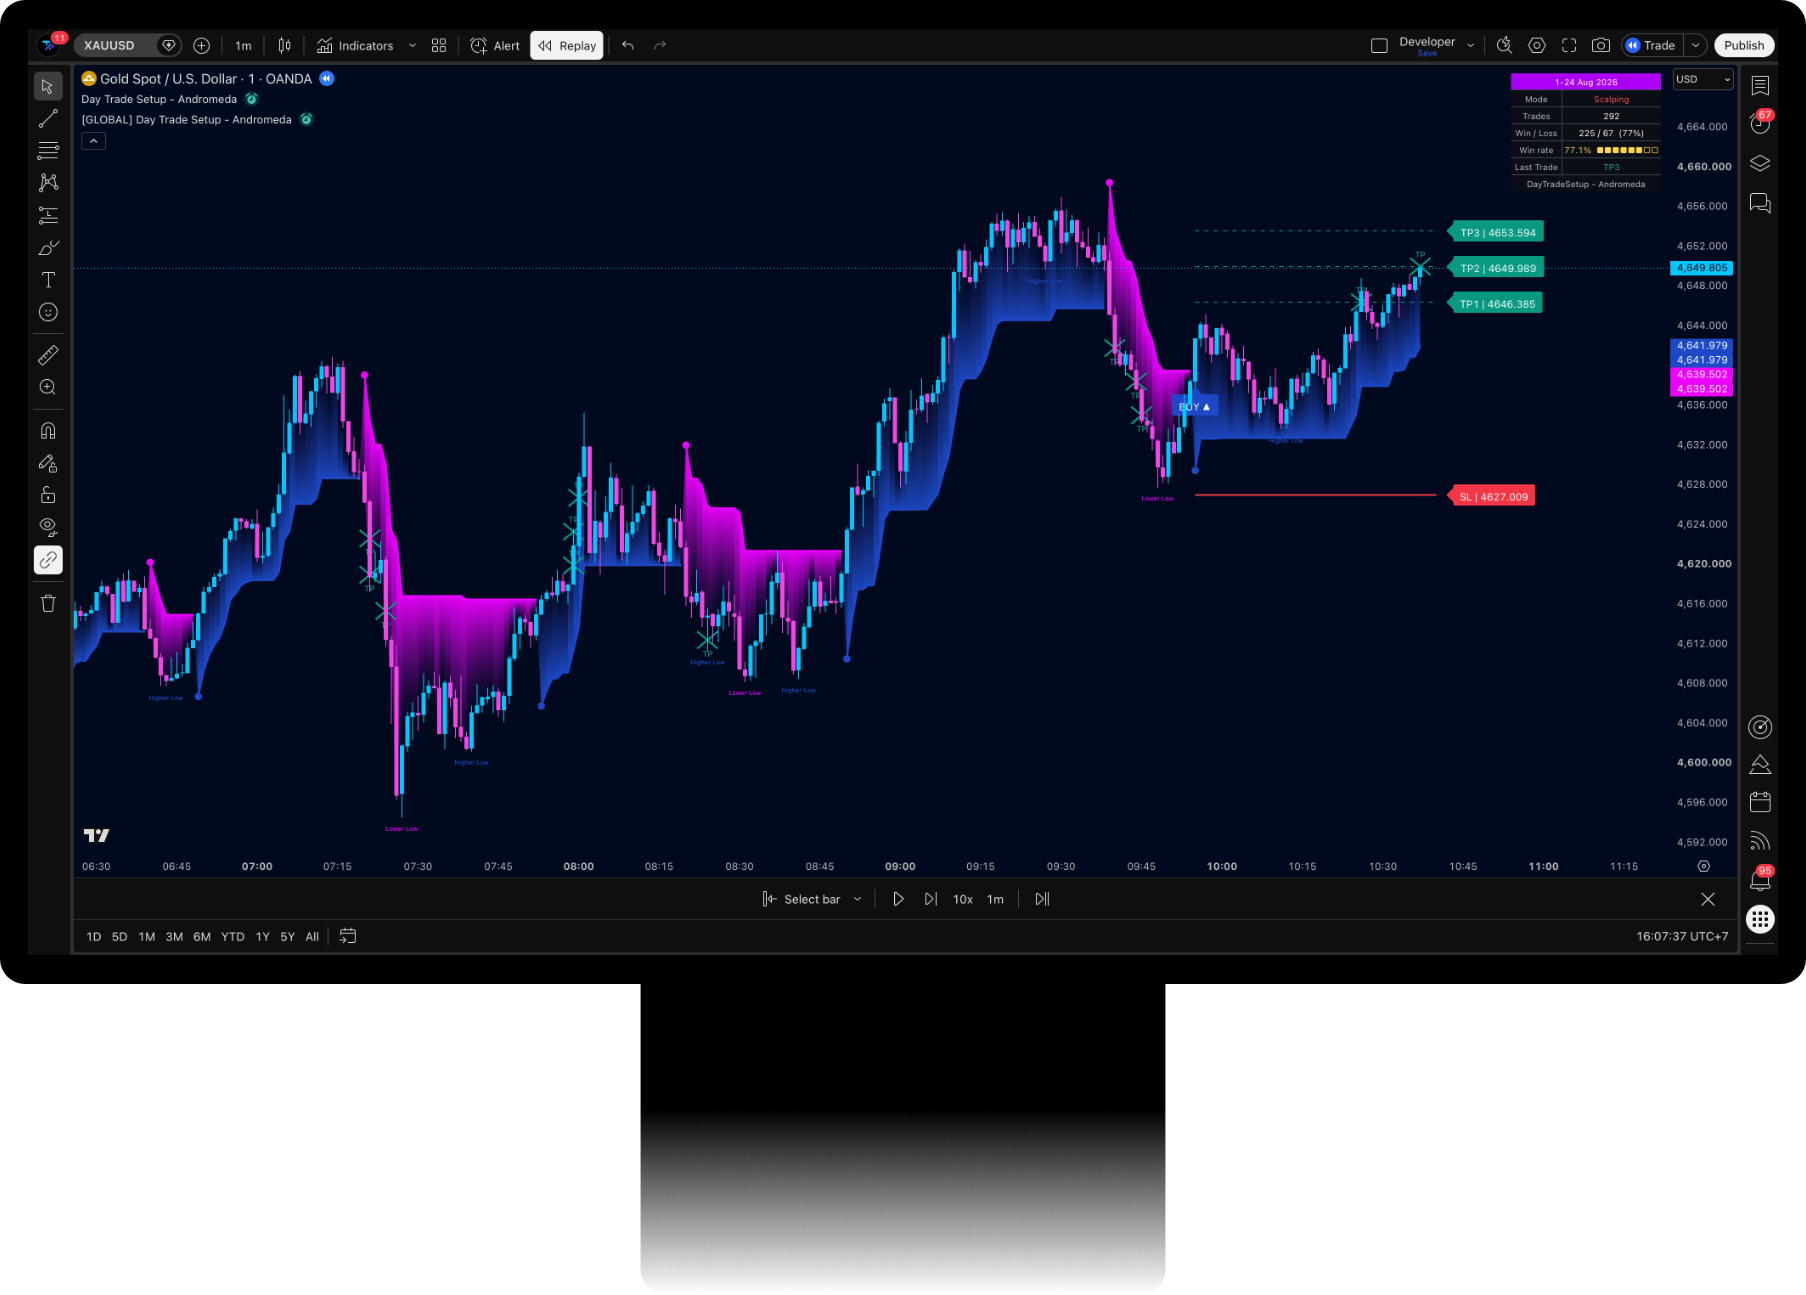
Scalping Mode identifies potential short-term trading opportunities based on confirmed changes in SuperTrend direction.

Once a signal is confirmed, the indicator will:

  • Identify the Buy or Sell signal candle
  • Calculate the Stop Loss automatically
  • Display three Take Profit levels
  • Track the outcome of the setup
  • Record the result of the latest signal

This mode is suitable for users looking for short-term setups based on SuperTrend direction and clearly defined price levels for trade planning.

Understand the Market Before You Trade

Market Structure Analysis

Day Trade Setup – Andromeda includes a built-in Market Structure analysis system designed to help users understand market direction and price behavior more clearly. The system can identify:

Break of Structure (BoS)

Price breaks an important structure level in the direction of the existing trend.

Change of Character (CHoCH)

Price breaks structure against the previous trend, indicating a possible directional change.

Bullish Market Structure

A sequence of Higher Highs and Higher Lows, suggesting an upward trend bias.

Bearish Market Structure

A sequence of Lower Highs and Lower Lows, suggesting a downward trend bias.

Market Structure can be used as a directional filter to help reduce setups that move against the current market trend. Users should consider Market Structure together with Price Action, Liquidity, Trading Sessions, and higher-timeframe context.

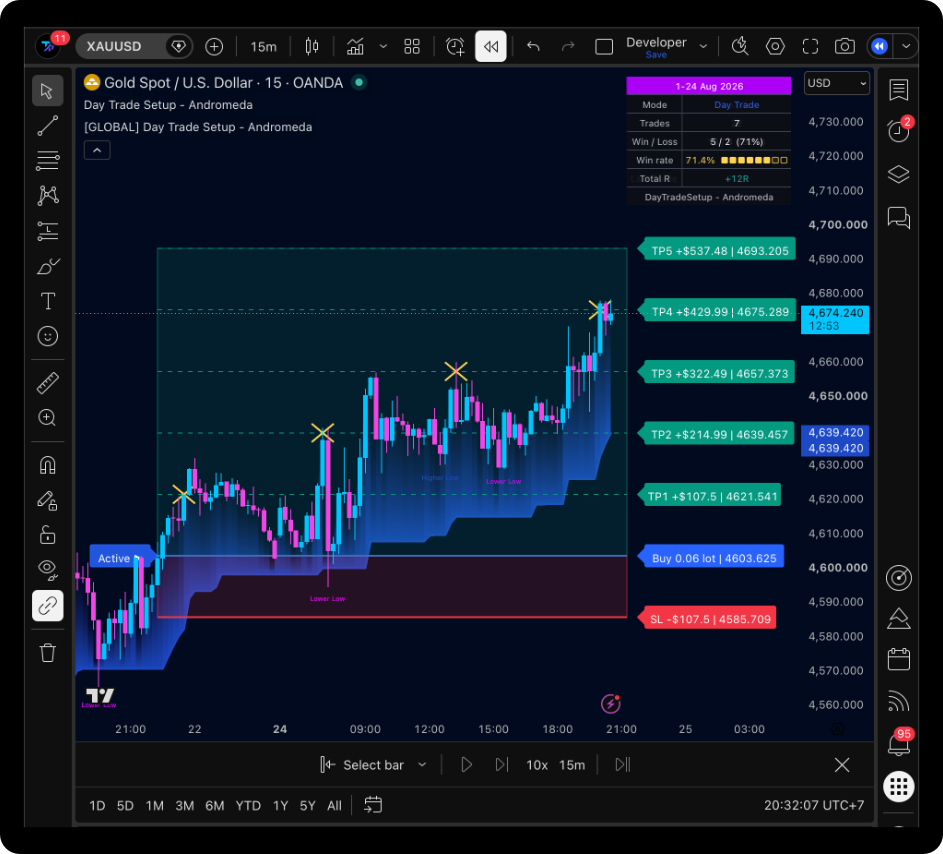
Day Trade Setup — Andromeda displaying Entry, Stop Loss, multiple Take Profit levels, suggested lot size, and estimated profit on a TradingView chart

Entry, Stop Loss, and Take Profit on Your Chart

Automatic Trade Planning

When a valid setup is detected, the system automatically displays important price levels directly on the chart, including:

  • Entry
  • Stop Loss
  • Take Profit
  • Suggested lot size
  • Estimated profit or loss

These displayed levels are designed to help users plan before entering a trade, reduce emotion-based decisions, and understand the potential risk of each setup more clearly.

Users should review all displayed price levels and adjust their trading plan according to current market conditions before placing any live trade.

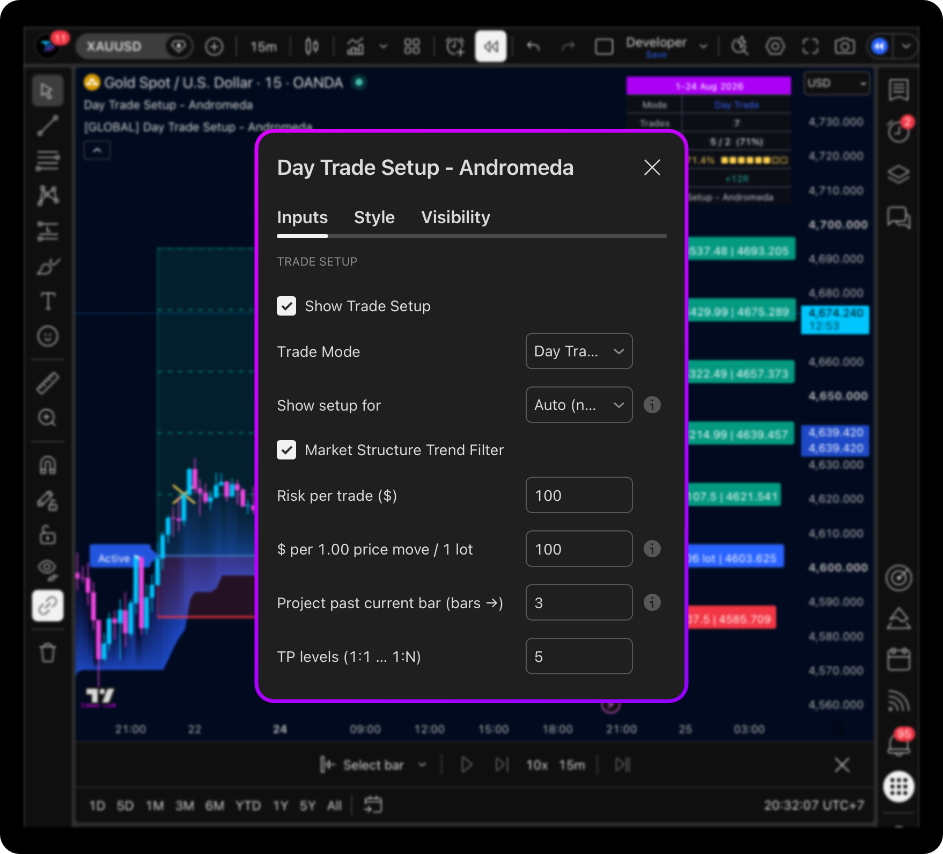
Day Trade Setup — Andromeda's Trade Setup input panel, showing Risk per trade, contract value per 1.00 price move, and TP levels settings

Plan Your Risk Before Entering the Market

Automatic Risk Management

The system calculates a suggested lot size based on the information selected by the user, including:

  • The amount of money the user is willing to risk per setup
  • Entry price
  • Distance between the Entry and Stop Loss
  • Contract Value of the selected asset

For XAUUSD, the default calculation estimates that a price movement of 1.00 is approximately equal to USD 100 when trading 1 Standard Lot.

However, contract specifications may vary between brokers. Users should verify the Contract Value and adjust the settings to match their trading account and selected asset.

The displayed lot size is only an estimate intended to assist with risk planning. It is not a recommendation to automatically open a trade using that lot size.

Know Exactly Where Your Setup Stands

Setup Status

The system divides each setup into three status levels, allowing users to follow the progress of a setup clearly.

WAIT

The system has detected a potential trading setup, but the entry conditions have not yet been confirmed. Users should wait for the price to reach the Entry level and for the confirmation candle to close before considering a trade. Entering a trade while the setup remains in Wait status is not recommended.

ACTIVE

The price has reached the Entry level, and the signal candle has closed with confirmation. The setup is then locked, and the system begins tracking its performance on the chart while displaying the Entry, Stop Loss, Take Profit, and risk-management information.

COMPLETED

The setup ends when the price reaches the Stop Loss or the final Take Profit level. The system records the highest Take Profit level reached by each completed setup and displays the result in the setup history and Performance Dashboard.

Track Your Setups at a Glance

Performance Dashboard

The Performance Dashboard provides a monthly summary of the setups generated by the indicator. The displayed information includes:

Day Trade Setup — Andromeda's on-chart Performance Dashboard, showing Mode, Trades, Win/Loss, Win rate, and Total R

Statistics are automatically reset at the beginning of each new calendar month.

Note: The Dashboard only displays results from setups generated by the indicator. It does not connect to or retrieve results from the user's live trading account.

Stay Updated When a Setup Becomes Active

Real-Time Trading Alerts

Day Trade Setup – Andromeda supports alerts when a setup changes to Active status in either trading mode. Supported alerts include:

Active Trading Signals

Real-time alerts for active Day Trade and Scalping setups.

Buy Signal

Sent when an active setup identifies a Buy direction.

Sell Signal

Sent when an active setup identifies a Sell direction.

Manual Alerts

Create alerts through the TradingView Alerts menu based on your selected conditions.

Telegram Updates

Follow trading signals and additional updates through the Day Trade Setup Telegram group, subject to your subscription plan's access rights.

Alert delivery speed may depend on the user's internet connection, device, TradingView platform performance, and third-party service providers.

A Simple and Structured Trading Process

How to Use
Day Trade Setup – Andromeda

01

Check the Market Direction

Review the overall market direction using Market Structure, SuperTrend, and higher-timeframe context.
02

Wait for a Valid Setup

Wait for the system to identify a Buy or Sell setup that meets the conditions of the selected trading mode.
03

Wait for Confirmation

Avoid entering a trade while the setup remains in Wait status. Wait for the price to reach the Entry level and for the confirmation candle to close, causing the setup to change to Active.
04

Review Your Trade Plan

Review the information displayed by the system, including:
  • Entry
  • Stop Loss
  • Take Profit
  • Suggested lot size
  • Risk-to-Reward
  • Estimated profit or loss
05

Confirm the Market Context

Consider additional factors before making a trading decision, such as:
  • Price Action
  • Liquidity
  • Trading Session
  • Economic news
  • Support and Resistance
  • Market Structure
  • Higher-timeframe context
06

Manage Your Risk

Adjust the lot size according to your account size and personal risk tolerance. Do not use the displayed lot size without first verifying the Contract Value and your broker's contract specifications.

Designed for XAUUSD

Day Trade Setup – Andromeda can be used with various assets available on TradingView. However, the default risk-management settings are primarily designed for XAUUSD.

Recommended ChartXAUUSD — OANDA

To maintain consistency with the default chart data and price settings.

When using the indicator with other assets, users should review and adjust the following settings accordingly:

Contract Value
Risk Amount
Lot Size
Timeframe
Trading Session
Asset volatility

Confirmed Candle Processing

Built for Signal Stability

The activation and completion of each setup are processed using closed and confirmed candles. This approach helps reduce:

Signals flashing or changing within an open candle
Status changes before the candle closes
Real-time signal instability
Decisions based on signals that have not yet been confirmed

Swing Points used by the Market Structure system must meet the required confirmation conditions before they are displayed on the chart. As a result, some structural information may appear after the price has already moved beyond the Swing Point. This is a normal part of confirmed Market Structure analysis.

Who Is This Indicator For?

Day Trade Setup – Andromeda is suitable for:

Traders who want to analyse XAUUSD systematically
Users who want clearly defined Entry, Stop Loss, and Take Profit levels
Traders who use Demand & Supply Zones
Traders who use SuperTrend
Traders who analyse Market Structure, BoS, and CHoCH
Users who want to plan risk before entering a trade
Users who want to track setups and statistics directly on TradingView
Beginners who need a structured approach to chart analysis
Experienced traders who want to reduce the number of manual analysis steps

This indicator is not suitable for users looking for guaranteed profits or those who intend to trade solely based on indicator signals without analysing the wider market context.

One Chart. Two Trading Modes. A More Structured Process.

Why Day Trade Setup – Andromeda?

Instead of relying on multiple separate indicators, Day Trade Setup – Andromeda combines essential tools for analysis, planning, and setup tracking within one integrated system.

Two Trading Modes

Choose between Day Trade Mode based on Demand & Supply Zones or Scalping Mode based on SuperTrend, depending on your preferred trading style.

Automatic Trade Planning

Automatically displays Entry, Stop Loss, Take Profit, and suggested lot size.

Market Context

Analyses Market Structure, Higher High, Higher Low, Lower High, Lower Low, BoS, and CHoCH.

Risk-Focused Design

Designed to help users understand the potential risk of each setup and plan their position size before entering a trade.

Performance Tracking

Track the number of setups, Win Rate, Total R, Last Trade, and monthly results through the Performance Dashboard.

Real-Time Active Signals

Supports alerts when a setup from Day Trade Mode or Scalping Mode changes to Active status.

Important Information

Historical results and information shown on the Performance Dashboard are based solely on setups generated by the indicator. These results do not include real-world trading factors such as:

  • Spread
  • Commission
  • Slippage
  • Swap
  • Order-execution delays
  • Internet connection speed
  • Market liquidity
  • Price differences between brokers
  • Differences in Contract Specifications
  • The user's actual trade-entry and trade-exit execution

Actual results from a live trading account may differ from the results displayed by the indicator.

Got Questions?

Frequently Asked Questions

The indicator is designed for use on TradingView.

The indicator includes two trading modes: Day Trade Mode based on Demand & Supply Zones and Scalping Mode based on confirmed SuperTrend signals.

The system identifies potential Buy and Sell setups around active Demand Zones and Supply Zones. It initially displays a Wait status and changes to Active when the price reaches the Entry level and the confirmation candle closes.

The system identifies opportunities based on confirmed changes in SuperTrend direction and displays a Buy or Sell signal, an automatic Stop Loss, and three Take Profit levels.

No. The indicator analyses the market, displays setups, and assists with trade planning. Users must place their own trading orders through their broker.

The indicator can be used with various assets, but its default risk-management settings are primarily designed for XAUUSD.

The recommended chart is XAUUSD — OANDA to maintain consistency with the indicator's default settings.

It means the system has identified a potential setup, but the entry conditions or candle confirmation have not yet been completed.

It is not recommended. Users should wait for the price to reach the Entry level and for the confirmation candle to close, causing the setup to change to Active.

The suggested lot size is calculated using the selected risk amount, Entry price, Stop Loss distance, and Contract Value of the asset.

Users should first verify the Contract Value and contract specifications provided by their broker, as these may vary between brokers.

No. The Dashboard summarises setups generated by the indicator and does not connect to the user's live trading account.

The statistics are automatically reset at the beginning of each new calendar month.

The activation and completion of setups are processed using confirmed candle closes to reduce signals changing within an open candle. However, Swing Points and Market Structure information must meet the required confirmation conditions before they appear on the chart.

Yes. Users can create TradingView alerts to receive notifications when a setup from Day Trade Mode or Scalping Mode changes to Active status.

Trading signals and additional updates may be available through the Telegram group, depending on the terms and access rights included in the selected subscription plan.

No. No indicator can guarantee profits or prevent trading losses.

Start Trading with a Clearer Structure

Identify setups, plan your risk, and track performance — all within a single chart. Day Trade Setup – Andromeda: built for structured trading on TradingView.